IVANS Benchmarks UI: Intuitive Data Visualization for Insurance Pricing
Crafting a user-friendly interface for complex insurance data analytics. It offers unparalleled access to data-driven insights for optimizing pricing strategies, thereby enhancing competitive edge and market positioning.
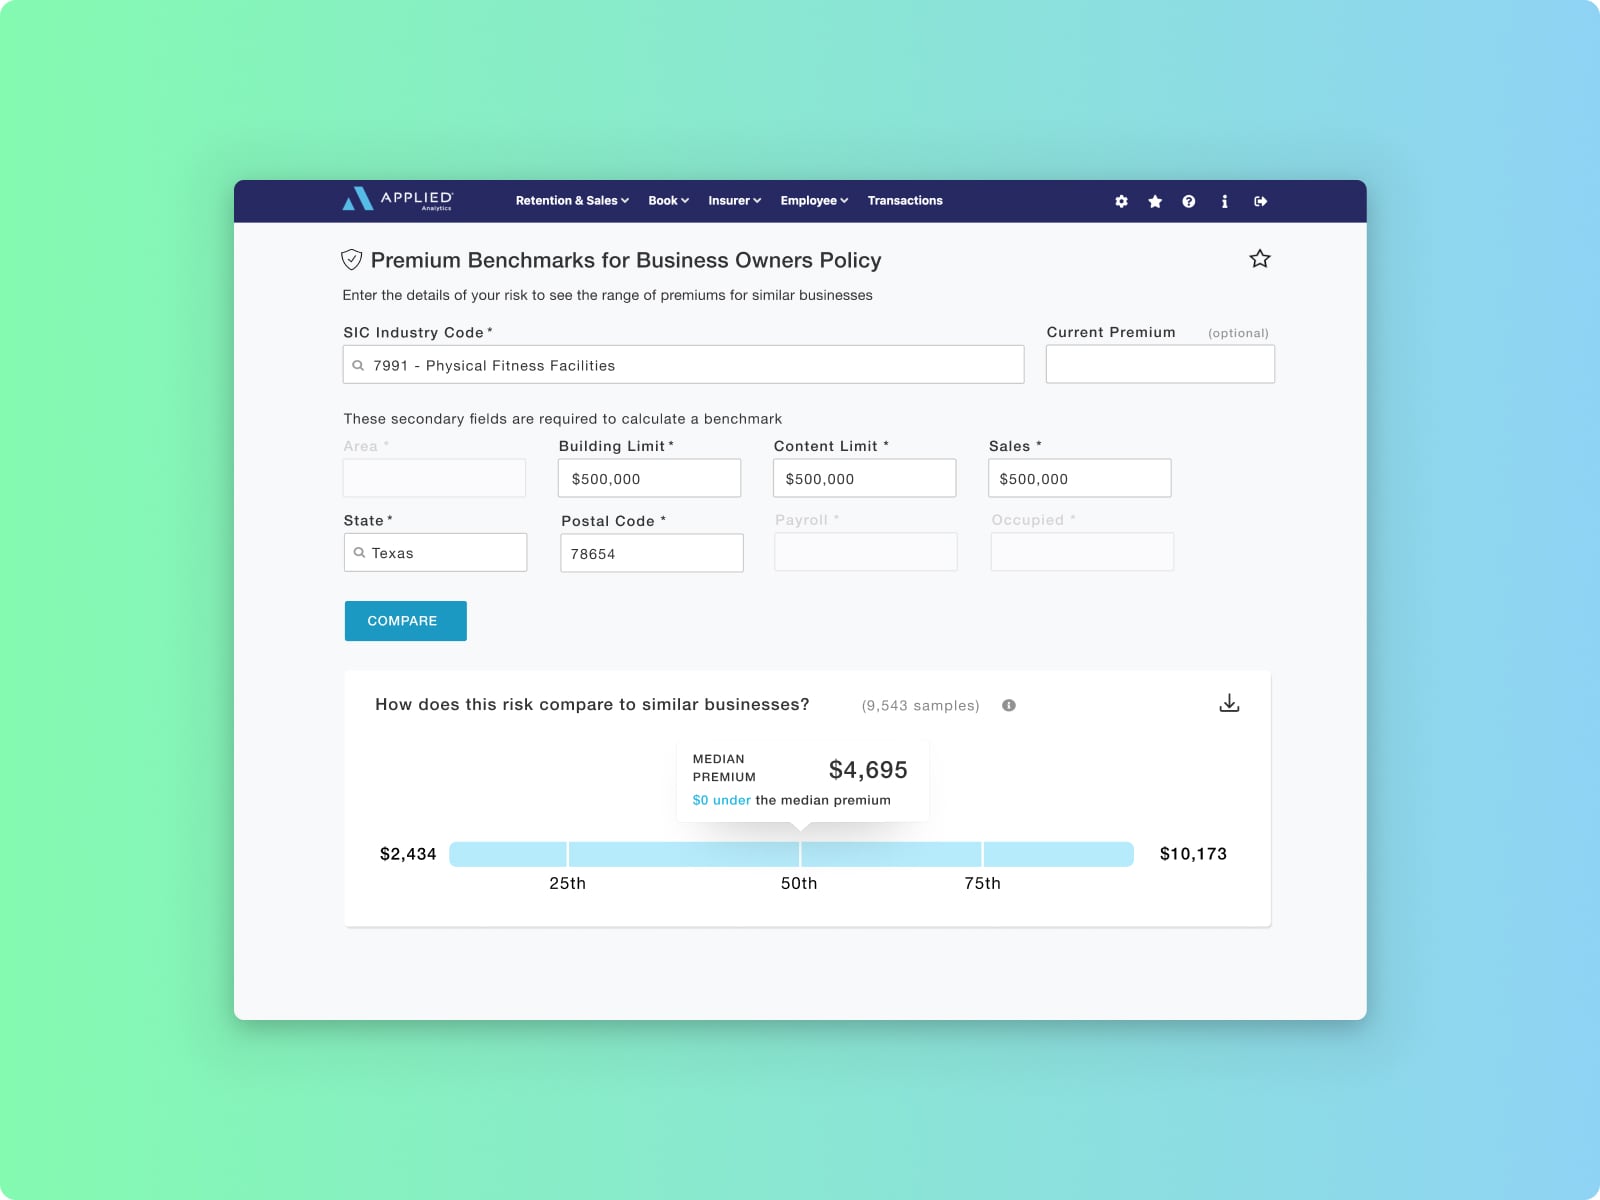
As a pivotal part of the IVANS Benchmarks project, my focus was to distill complex insurance data into a comprehensive and intuitive interface. This involved designing a user experience that allowed users to easily input data, observe benchmarks, and understand intricate analytics at a glance. The resulting design transformed the way insurance professionals interact with and leverage data for strategic decision-making.
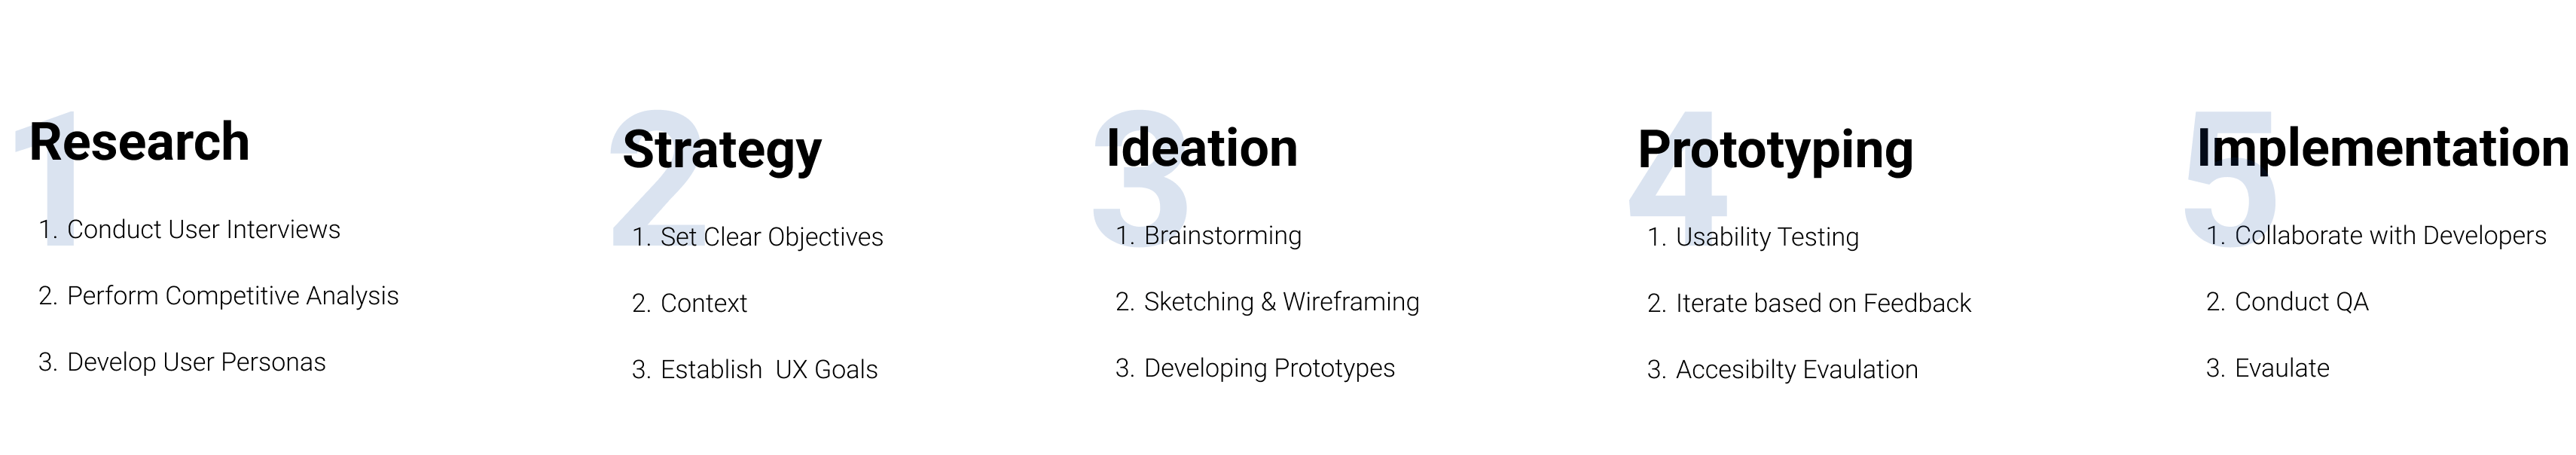
Lead UX Designer - Orchestrated the research, interaction design, and visual design, ensuring a cohesive user experience from concept to implementation.
The primary challenge was to accommodate a wealth of data into an accessible platform without overwhelming the user. Insurers needed to quickly input various parameters and receive benchmarks that could guide their pricing strategies. My task was to simplify the user journey, allowing for easy navigation and understanding of data points, thereby enhancing the decision-making process.
The target audience for IVANS Benchmarks is business owners and insurance professionals who are responsible for making informed decisions regarding insurance policy pricing and market strategies.


I approached the design by prioritizing clarity and efficiency. The UI features straightforward input fields for diverse data points and a responsive benchmark slider that offers immediate visual feedback on how specific inputs influence premium ranges. By implementing a clean layout, consistent visual elements, and interactive data visualization, I created a seamless experience that enables users to effortlessly interpret and act on complex data sets. The design's success is evidenced by its ability to facilitate rapid, informed decisions in a traditionally convoluted industry space.

IVANS Benchmarks emerged as a transformative solution in the insurance industry, enabling businesses to harness the power of data for strategic decision-making. This platform not only streamlines the process of competitive pricing analysis but also paves the way for innovative market strategies, ultimately contributing to the growth and sustainability of businesses in the rapidly evolving insurance landscape.
Reflecting on this project, I'm genuinely proud of the impact our project has made in simplifying the process of finding insights into pricing and market trends. The feedback has been overwhelmingly positive, underscoring the prototype's effectiveness. Looking ahead, our focus will be on refining the solution further, incorporating user feedback, and exploring opportunities for integration with other platforms to enhance the user experience even more. It's exciting to think about the potential for further innovation and improvement.